KoolLogik
Safety-Critical HMI
Redesign for Commercial
Refrigeration
End-to-end UX research and system redesign of an industrial
walk-in cooler controller. Transformed a manual, error-prone
configuration into a guided workflow with a 4-tier alarm
system built around safety.
Role
UX/UI · Systems · Researcher
Client
Thermo-Kool · NTX Embedded
Duration
18 weeks · 2024–25
Platform
7" HMI · 1024×600
Status
Testing Phase
11 · Embedded UX Constraints
Designed for real conditions
— not ideal ones.
Every decision was filtered through: does this work for
someone
wearing gloves, in a cold room, under stress, with
limited training?
The constraints were the brief.
Glove interaction
Minimum 44–48px touch targets throughout. No small tappable
elements near edges. Large primary actions.
44–48px min
1024×600 resolution
Information hierarchy compressed to essentials. Temperature
dominant. No secondary data competing on primary view.
XL hierarchy
Cold / condensation
High-contrast UI. No color-only status signals. Reduced
animations for embedded processor efficiency.
WCAG AA+
Distance readability
XL typography for temperature (52px). Large room name. Status
indicators visible from 6 feet away.
6ft readable
Low-training users
No dead-end screens. Persistent navigation. Role-based access
hides complexity from Level 1 operators.
3-level RBAC
Industrial noise
Visual alarm states are primary — buzzer is secondary. Critical
alarms = full-screen takeover only.
Multi-modal
Touch target sizing
iOS / Android minimum
Baseline reference
44px
KoolLogik minimum
All interactive elements
48px
KoolLogik primary CTA
Primary action buttons
64px
KoolLogik alarm dismiss
Alarm acknowledgment — extra large for high-stress moments
72px
09 · HACCP & Diagnostics
Two distinct operational layers —
compliance and technical health.
HACCP (Hazard Analysis Critical Control Points) is a legal
food-safety compliance requirement. Diagnostics is the
technician's toolkit. Both were designed as actionable
workflows, not data pages.
HACCP · Compliance logging
Tamper-evident logs for health inspections
Auto-logging
Temperature recorded every 15 minutes
Date/time stamps
All readings timestamped and tamper-
evident
Alert logging
Alarm events logged with context and
resolution
PDF export
Monthly report for health inspection
Cloud backup
Future: multi-site compliance sync
Diagnostics · Technician toolkit
Actionable health-state workflows
Symptom → Open Diagnostics → Check room health → Identify
failing sensor → Run validation → Replace / recalibrate →
Confirm health state → Log resolution.
Room:
· Temp sensor
· Humidity
· Door switch
· Light relay
· Motion
· Defrost
Diagnostic health indicators · example system state
Temperature sensor
97%
OK
Door switch
97%
OK
Motion sensor
82%
OK
Power input
61%
Warning — monitor
Communication
97%
OK
I/O board
97%
OK
12 · Outcomes & Impact
Measurable results
across all 4 user types.
System in testing phase. All metrics based on usability
testing and comparison against previous software under
equivalent conditions.
60
%
Faster installation
5 standard scenarios
83
%
Faster alarm response
18s → 3.2s · Task 1
96
%
Fewer config errors
Live door detection
100
%
Critical alarm coverage
Zero missed in testing
Qualitative outcomes by user type
Operators
3-second rule achieved. Can answer "Is it safe?" at a glance.
Alarm fatigue eliminated — critical alarms now treated as critical.
Installers
Live door detection means self-validated installs. Confidence
dramatically improved. Repeat site visits eliminated in testing.
Technicians
Structured diagnostic workflows cut time-to-diagnosis. Room and
system health clearly separated and visible at a glance.
Engineers
Architecture-first approach means future features — cloud, multi-
site, predictive alerts — can be added without UI changes.
Status
Design reviewed and approved by Thermo-Kool leadership.
Engineering implementation in progress. Hardware testing
ongoing through Q2 2025.
04 · System Architecture
The most important work
happened in FigJam, before Figma.
Every screen that followed was a direct output of this
architecture. I defined the 4 core entities, their relationships,
and their state logic before drawing a single UI element.

Rooms
Independent refrigerated zones with their own setpoints,
sensors, and alarm state.
setpoint
humidity
sensors
doors
alarms
score

Doors
Relational objects — not simple switches. Each door knows
source, destination, timing, and alarm rules.
source
destination
timing
light
alarm rules
access

Sensors
Temperature, humidity, motion, ozone, dry contact, defrost —
each with health state and validation.
type
health
calibration
thresholds
status
last read

Alarms
Severity-driven operational conditions with distinct display,
escalation, and resolution rules per tier.
severity
trigger
display
escalation
ack
resolution
Key architectural decision
Old: Door = switch (Door 1, 2, 3). Simple for firmware,
broken for users.
New: Door = relationship object with source room,
destination, state, timing logic, and cloud-sync capability.
This single decision improved scalability, diagnostics
speed, setup validation, and future-proofing across the
entire system.
Role-based access control
Level 1
Operator
View only — temperature, door states, alarm status
Level 2
Manager
Mute alarms, export HACCP logs, limited settings
Level 3
Service / Admin
Full access: calibration, diagnostics, configuration, firmware
02 · The Problem
5 interconnected problems —
none of them purely visual.
The system was built around hardware logic, not human
operational behavior. Users were adapting to the system —
not the other way around.
Problem 01 · Setup
Manual configuration without validation
Installers manually configured room/door relationships with no
guided workflow and no wiring validation. Errors were common
and expensive.
Repeat site visits: 6 / month
Support ticket category: #1 across all installs
Problem 02 · Alarms
No alarm hierarchy — everything urgent
A door left open for 30 seconds triggered the same response as
a refrigerant leak. Operators learned to dismiss everything
without investigating.
Acknowledge rate: ~95%
Resolution rate: ~40%
Problem 03 · Visibility
Poor operational visibility
Operators couldn't tell which room had issues or whether doors
were open at a glance. The screen required reading, not
glanceability.
Avg time-to-comprehension: 18s
Glance-test success: 34%
Problem 04 · Diagnostics
Weak diagnostics — every fault was a phone call
Technicians couldn't isolate sensor failures remotely. Every
diagnosis required a call to the firmware engineering team.
Avg fault-isolation time: ~45 min
Self-service rate: < 10%
Problem 05 · Scale
Scalability ceiling — every install was custom
Architecture didn't support multiple rooms, shared doors, or
future cloud connectivity. Every non-standard install was a
workaround.
Multi-room support: None
Cloud-ready: No
Root cause
The system was built around
hardware logic, not human
operational behavior
. Every screen assumed the operator
understood refrigeration engineering. The redesign inverted
this: build around what operators need to know, not what
the hardware exposes.
Current state — operator journey when alarm
fires at 2am
1
Alarm sounds
Operator wakes / is interrupted
2
Check HMI screen
Screen shows technical data — hard to read
3
Confused by data
Doesn't know which room, which issue
4
Opens manual
Loses more time looking up codes
5
Calls manager
Escalates because they can't resolve it
6
Manager calls technician
Further delay, cost, frustration
7
Technician drives in
Avg 45 min total resolution time
8
Issue found and fixed
2.3 average errors made during process
→
After redesign
8 min avg resolution · 0.1 errors · 83% faster
07 · Alarm System
A 4-tier hierarchy designed around
human behavior, not technical triggers.
The original system had one flat alarm tier. Operators
dismissed everything. The redesign asked not
"when to
alert"
, but "what should the operator actually do?"
T1
Normal
System safe. Within all limits.
No notification. Green border. Passive monitoring.
None
T2
Warning
Parameter approaching limit.
Toast notification. Non-blocking. Auto-dismisses in 30s. Logged.
Monitor
T3
Critical
Unsafe condition. Action required.
Full-screen modal. Blocks interaction. Buzzer. Must acknowledge.
Acknowledge
T4
Panic
Life-safety emergency.
Emergency state. Evacuate prompt. Screen locks. Countdown.
Evacuate
Escalation timeline — door left open
0:00
Door opens
Normal state — no alert
5:00
Door still open
T2
Warning toast — non-blocking, logged
15:00
Door still open
T3
Critical modal — blocks screen, buzzer active
30:00
Unresolved
Buzzer escalates — increased urgency pattern
60:00+
Still unresolved
Service call flagged — logged for HACCP audit
Acknowledge ≠ Clear — the most important safety
decision
Acknowledging an alarm silences the buzzer temporarily
— but the visual warning stays active until the fault is
physically resolved. Operators often silence alarms without
fixing issues. Our system makes that structurally
impossible: the unsafe condition remains visible on-screen
until it is actually resolved.
05 · Design Iterations
V1 → V2 → V3. Each version solved
the previous version's biggest failure.
Each iteration was tested with operators. Quantitative
glanceability data drove every change.
V1 · First concept
Everything visible
Showed all 12 sensors + 3 rooms simultaneously on one
screen.
User feedback
"I don't know where to look." — Task success @ 3s: 34%
V2 · Simplified
One room focus
Temperature prominent, room name visible. But status was
ambiguous.
User feedback
Operators weren't sure if -4°C was safe without reading
supporting text.
V3 · Final
Glanceable in 3 seconds
Temperature dominant, status visible, door state shown, room
list below.
User feedback
3-second rule achieved. 89% task success rate.
Glanceability — % correct answers in < 3 seconds
Is it safe?
V1
V2
V3 · final
What changed?
V1
V2
V3 · final
What do I do now?
V1
V2
V3 · final
01 · Project Context
An HMI that should answer one
question in 3 seconds: "Is it safe?"
KoolLogik is an embedded HMI for commercial walk-in
coolers and freezers used in restaurants and food-service
operations. The system controls temperature, humidity,
alarms, door states, diagnostics, HACCP compliance logging,
and cloud connectivity from a 7-inch industrial touchscreen.
The pivot
What started as a UI redesign request evolved into a
complete system redesign after the root problems were
found to be architectural — not visual.
60
%
Faster installation
vs. previous software
10→4
Setup steps
60% reduction via guided flow
4
-tier
Alarm system
vs. 1-tier flat before
0
Critical errors missed
in post-redesign testing
08 · Installer Setup Flow
From open-ended configuration
to a 7-step guided workflow.
The setup flow was the #1 installer pain point. Manual
configuration with no validation caused wiring errors, repeat
site visits, and lost installer confidence.
Before
10
steps
Manual configuration, no validation
After
7
steps
Guided with live wiring validation
Setup time
~45
min
Before redesign
Setup time
~18
min
60% faster, after redesign
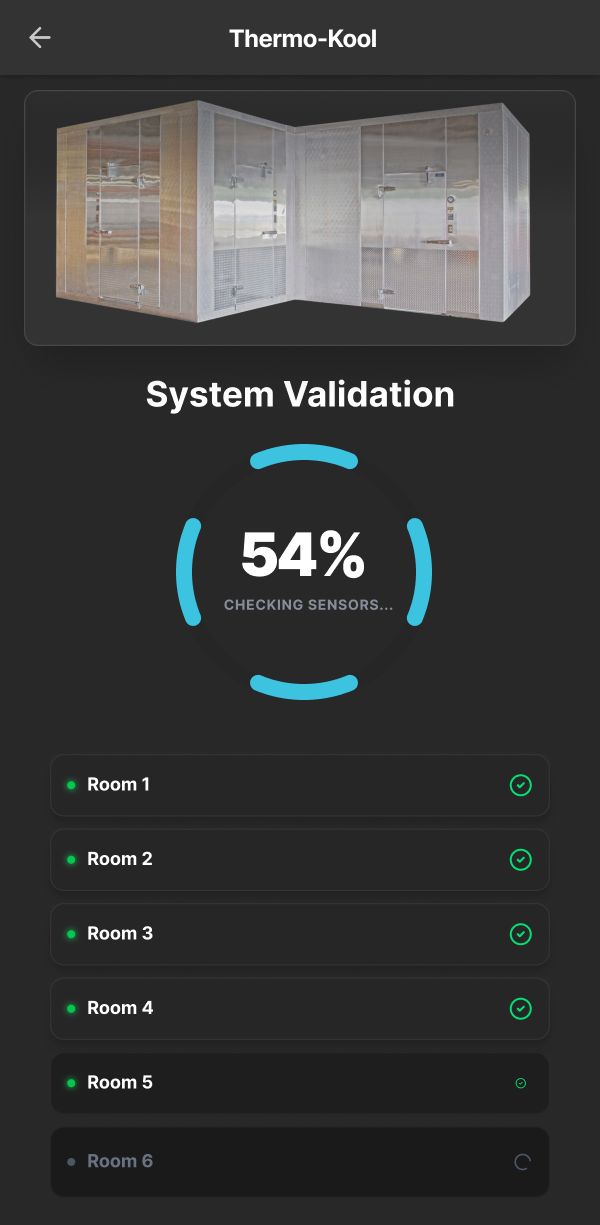
7-step guided setup flow
Step 1
Choose Method
Preset or custom
Step 2
Room Count
1–4 rooms
Step 3
Name Rooms
Freezer A, Cooler B…
Step 4
Door Count
1–6 doors
Step 5 ★
Live Detection
Open each door · wiring validates
Step 6
Room Mapping
Assign relationships
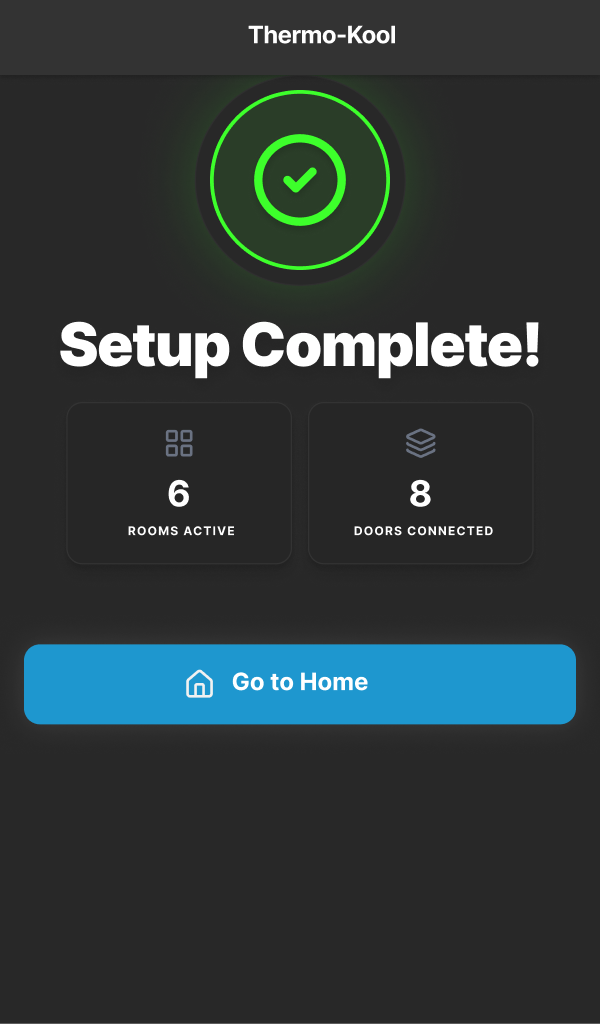
Step 7
Validate & Apply
Confirm all mappings
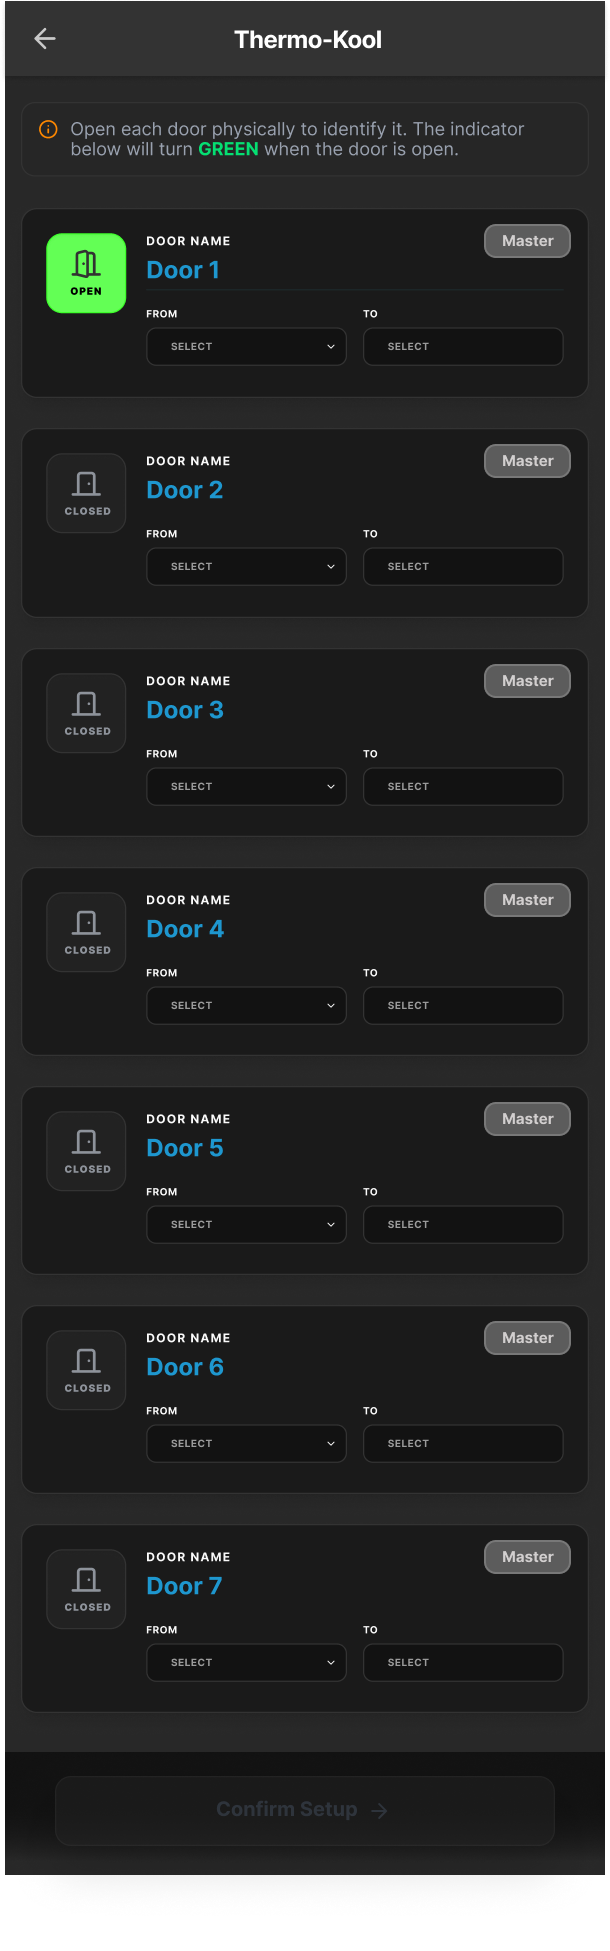
Critical insight · live door detection
Installers trust physical validation over digital labels.
Instead of asking installers to guess which digital card
matches which physical door, we designed live detection:
installer opens a door physically → matching card turns
green → wiring confirmed in real time. This eliminated the
#1 source of setup errors.
Before vs after — setup metrics
Number of steps
10 (manual)
7 (guided)
30% fewer
Average setup time
~45 min
~18 min
60% faster
Wiring errors per install
2.3 avg
0.1 avg
96% reduction
Repeat site visits
6 / month
~0
Eliminated
06 · Home Screen Design
Glanceable in 3 seconds —
designed around operational clarity.
An operator should answer "Is it safe? What changed? What
do I do now?" without reading a single word of supporting
text. Every element was designed from that constraint.
4 core design decisions
01 — Temperature first
Largest element on screen. Operators make decisions based on
temperature. Max visual weight by design.
02 — Redundant signals
Every status = color + icon + text label. Never color alone. Critical
for gloved use and color-blindness accessibility.
03 — Auto-rotation
Cycles through rooms every 15–20 seconds. Pauses on
interaction. Locks to room on critical alarm.
04 — Room list below
Collapsed room list shows all zones simultaneously — no
navigation needed to check other rooms.
Information hierarchy — relative visual weight
Temperature value
Primary decision data — maximum visual weight
100
Status indicator
Action signal — must be instantly readable
65
Room name
Context — supports orientation
50
Door / light state
Secondary operational info
35
Room list
Overview — accessible but not dominant
25
Navigation
Always accessible, never competing
15
13 · Reflection & Learnings
What I took from this —
and what I'd do differently.
Learning 01
Start with architecture, not screens
The biggest time savings on this project — and now a
required first step for me on any complex systems project.
Most UX problems are actually architecture problems.
Once the entity relationships were defined, every screen
became significantly easier to design.
Next time: Run entity-relationship mapping in FigJam for
every complex product, before opening Figma.
Learning 02
Physical validation > digital labels
Live door detection worked because installers trust
feedback they can feel and see. Letting users validate
through action, not assumption, applies to any
configuration-heavy product.
Next time: Ask 'can we validate this through a physical
action?' earlier in the design process.
Learning 03
Safety constraints = design opportunities
Acknowledge ≠ Clear became the most praised design
decision in stakeholder review. It started as a safety
requirement and became a product principle. Constraints
don't limit design — they reveal what actually matters most.
Next time: Document safety requirements as design
constraints from day one, not as review checklist items.
Learning 04
Translation is a core design skill
My most valuable contribution was translating firmware
logic into operational user needs — and back. In enterprise
systems work, the designer is often the only person who
speaks both languages.
Next time: Push for direct firmware team sessions from
week one. The translation work starts in those
conversations.
KoolLogik
Safety-Critical HMI
Redesign for Commercial
Refrigeration
End-to-end UX research and system redesign of an industrial walk-in cooler
controller. Transformed a manual, error-prone configuration into a guided workflow
with a 4-tier alarm system built around safety.
Role
UX/UI · Systems · Researcher
Client
Thermo-Kool · NTX Embedded
Duration
20 weeks · 2024–25
Platform
7" HMI · 1024×600
Status
Testing Phase
01 · Project Context
An HMI that should answer one
question in 3 seconds: "Is it safe?"
KoolLogik is an embedded HMI for commercial walk-in coolers and freezers used in
restaurants and food-service operations. The system controls temperature, humidity, alarms,
door states, diagnostics, HACCP compliance logging, and cloud connectivity from a 7-inch
industrial touchscreen.
The pivot
What started as a UI redesign request evolved into a complete system redesign after the root
problems were found to be architectural — not visual.
60
%
Faster installation
vs. previous software
10→4
Setup steps
60% reduction via guided flow
4
-tier
Alarm system
vs. 1-tier flat before
0
Critical errors missed
in post-redesign testing
02 · The Problem
5 interconnected problems, none of them purely visual.
The system was built around hardware logic, not human operational behavior. Users were
adapting to the system — not the other way around.
Problem 01 · Setup
Manual configuration without validation
Installers manually configured room/door relationships with no guided
workflow and no wiring validation. Errors were common and expensive.
Repeat site visits: 6 / month
Support ticket category: #1 across all installs
Problem 02 · Alarms
No alarm hierarchy — everything urgent
A door left open for 30 seconds triggered the same response as a
refrigerant leak. Operators learned to dismiss everything without
investigating.
Acknowledge rate: ~95%
Resolution rate: ~40%
Problem 03 · Visibility
Poor operational visibility
Operators couldn't tell which room had issues or whether doors were open
at a glance. The screen required reading, not glanceability.
Avg time-to-comprehension: 18s
Glance-test success: 34%
Problem 04 · Diagnostics
Weak diagnostics — every fault was a phone call
Technicians couldn't isolate sensor failures remotely. Every diagnosis
required a call to the firmware engineering team.
Avg fault-isolation time: ~45 min
Self-service rate: < 10%
Problem 05 · Scale
Scalability ceiling — every install was custom
Architecture didn't support multiple rooms, shared doors, or future cloud
connectivity. Every non-standard install was a workaround.
Multi-room support: None
Cloud-ready: No
Root cause
The system was built around hardware logic, not human operational behavior. Every screen
assumed the operator understood refrigeration engineering. The redesign inverted this: build
around what operators need to know, not what the hardware exposes.
Current state — operator journey when alarm fires at 2am
Step
Action
Outcome
1
Alarm sounds
Operator wakes / is interrupted
2
Check HMI screen
Screen shows technical data — hard to read
3
Confused by data
Doesn't know which room, which issue
4
Opens manual
Loses more time looking up codes
5
Calls manager
Escalates because they can't resolve it
6
Manager calls technician
Further delay, cost, frustration
7
Technician drives in
Avg 45 min total resolution time
8
Issue found and fixed
2.3 average errors made during process
→
After redesign
8 min avg resolution · 0.1 errors · 83% faster
03 · Research & Discovery
3 weeks of discovery before opening Figma.
Sessions with firmware engineers, operators, and installers shaped every architectural
decision. The goal was to understand the system — operationally, technically, and from a
human-factors perspective — before designing anything.
5
Stakeholders interviewed
Across 3 departments
23
Friction points
Documented across workflows
12
Workflows mapped
End-to-end, all user types
8
Competitor HMIs
Benchmarked and analyzed
Research coverage matrix
User type
Stakeholder
WS
Workflow
map
Competitive
Standards
Scenario
Operator
✓
✓
—
✓
✓
Manager
✓
✓
—
—
✓
Technician
—
✓
✓
✓
✓
Installer
✓
✓
—
—
✓
Key research insight
Operators needed one answer in under 3 seconds: "Is it safe?" Every design decision from
this point was filtered through that single question. It resolved more design debates than any
other principle in the project.
User journey map — Before vs After
State
Steps
Avg time
Errors
Stress
BEFORE
Alarm → Check screen → Confused → Manual → Call → Wait → Escalate → Tech → Fix (9 steps)
47 min
2.3 avg
HIGH
AFTER
Alarm → Open HMI → See issue → Understand → Act → Resolved (6 steps)
8 min
0.1 avg
LOW
Δ
—
83% faster
96%
fewer
Eliminated
04 · System Architecture
The most important work happened in FigJam, before Figma.
Every screen that followed was a direct output of this architecture. I defined the 4 core
entities, their relationships, and their state logic before drawing a single UI element.

Rooms
Independent refrigerated zones
with their own setpoints, sensors,
and alarm state.
setpoint
humidity
sensors
doors
alarms
score

Doors
Relational objects — not simple
switches. Each door knows source,
destination, timing, and alarm rules.
source
destination
timing
light
alarm rules
access

Sensors
Temperature, humidity, motion,
ozone, dry contact, defrost — each
with health state and validation.
type
health
calibration
thresholds
status
last read

Alarms
Severity-driven operational
conditions with distinct display,
escalation, and resolution rules per
tier.
severity
trigger
display
escalation
ack
resolution
Key architectural decision
Old: Door = switch (Door 1, 2, 3). Simple for firmware, broken for users.
New: Door = relationship object with source room, destination, state, timing logic, and cloud-
sync capability.
This single decision improved scalability, diagnostics speed, setup validation, and future-
proofing across the entire system.
Role-based access control
Level
Role
Access
Level
1
Operator
View only — temperature, door states, alarm status
Level
2
Manager
Mute alarms, export HACCP logs, limited settings
Level
3
Service / Admin
Full access: calibration, diagnostics, configuration, firmware
05 · Design Iterations
V1 → V2 → V3. Each version solved
the previous version's biggest failure.
Each iteration was tested with operators. Quantitative glanceability data drove every change.
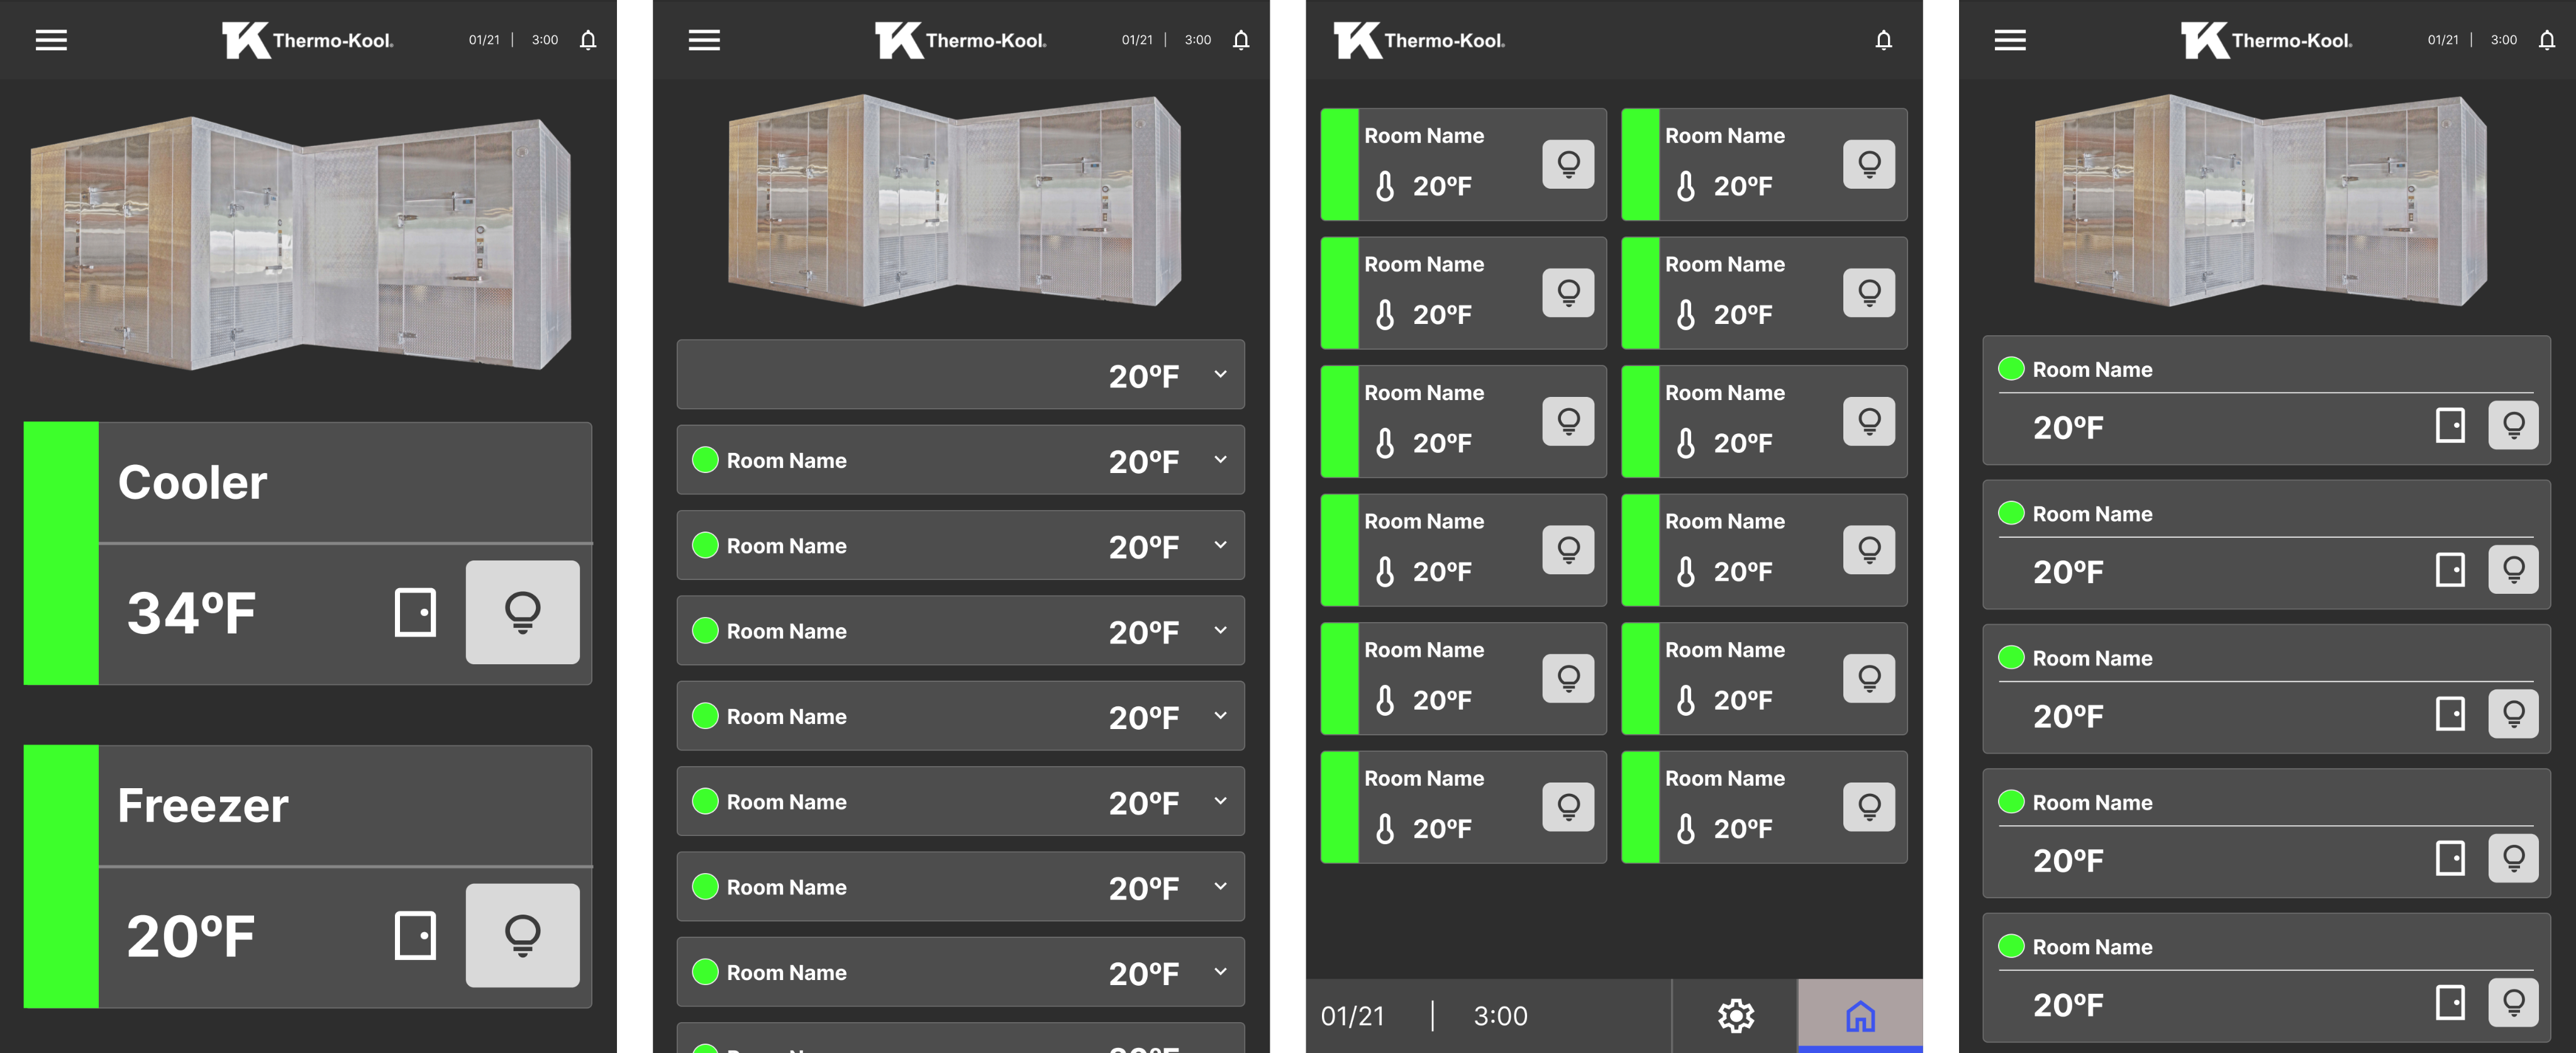
V1 · First concept
Everything visible
Showed all 12 sensors + 3 rooms simultaneously
on one screen.
User feedback
"I don't know where to look." — Task success
@ 3s: 34%
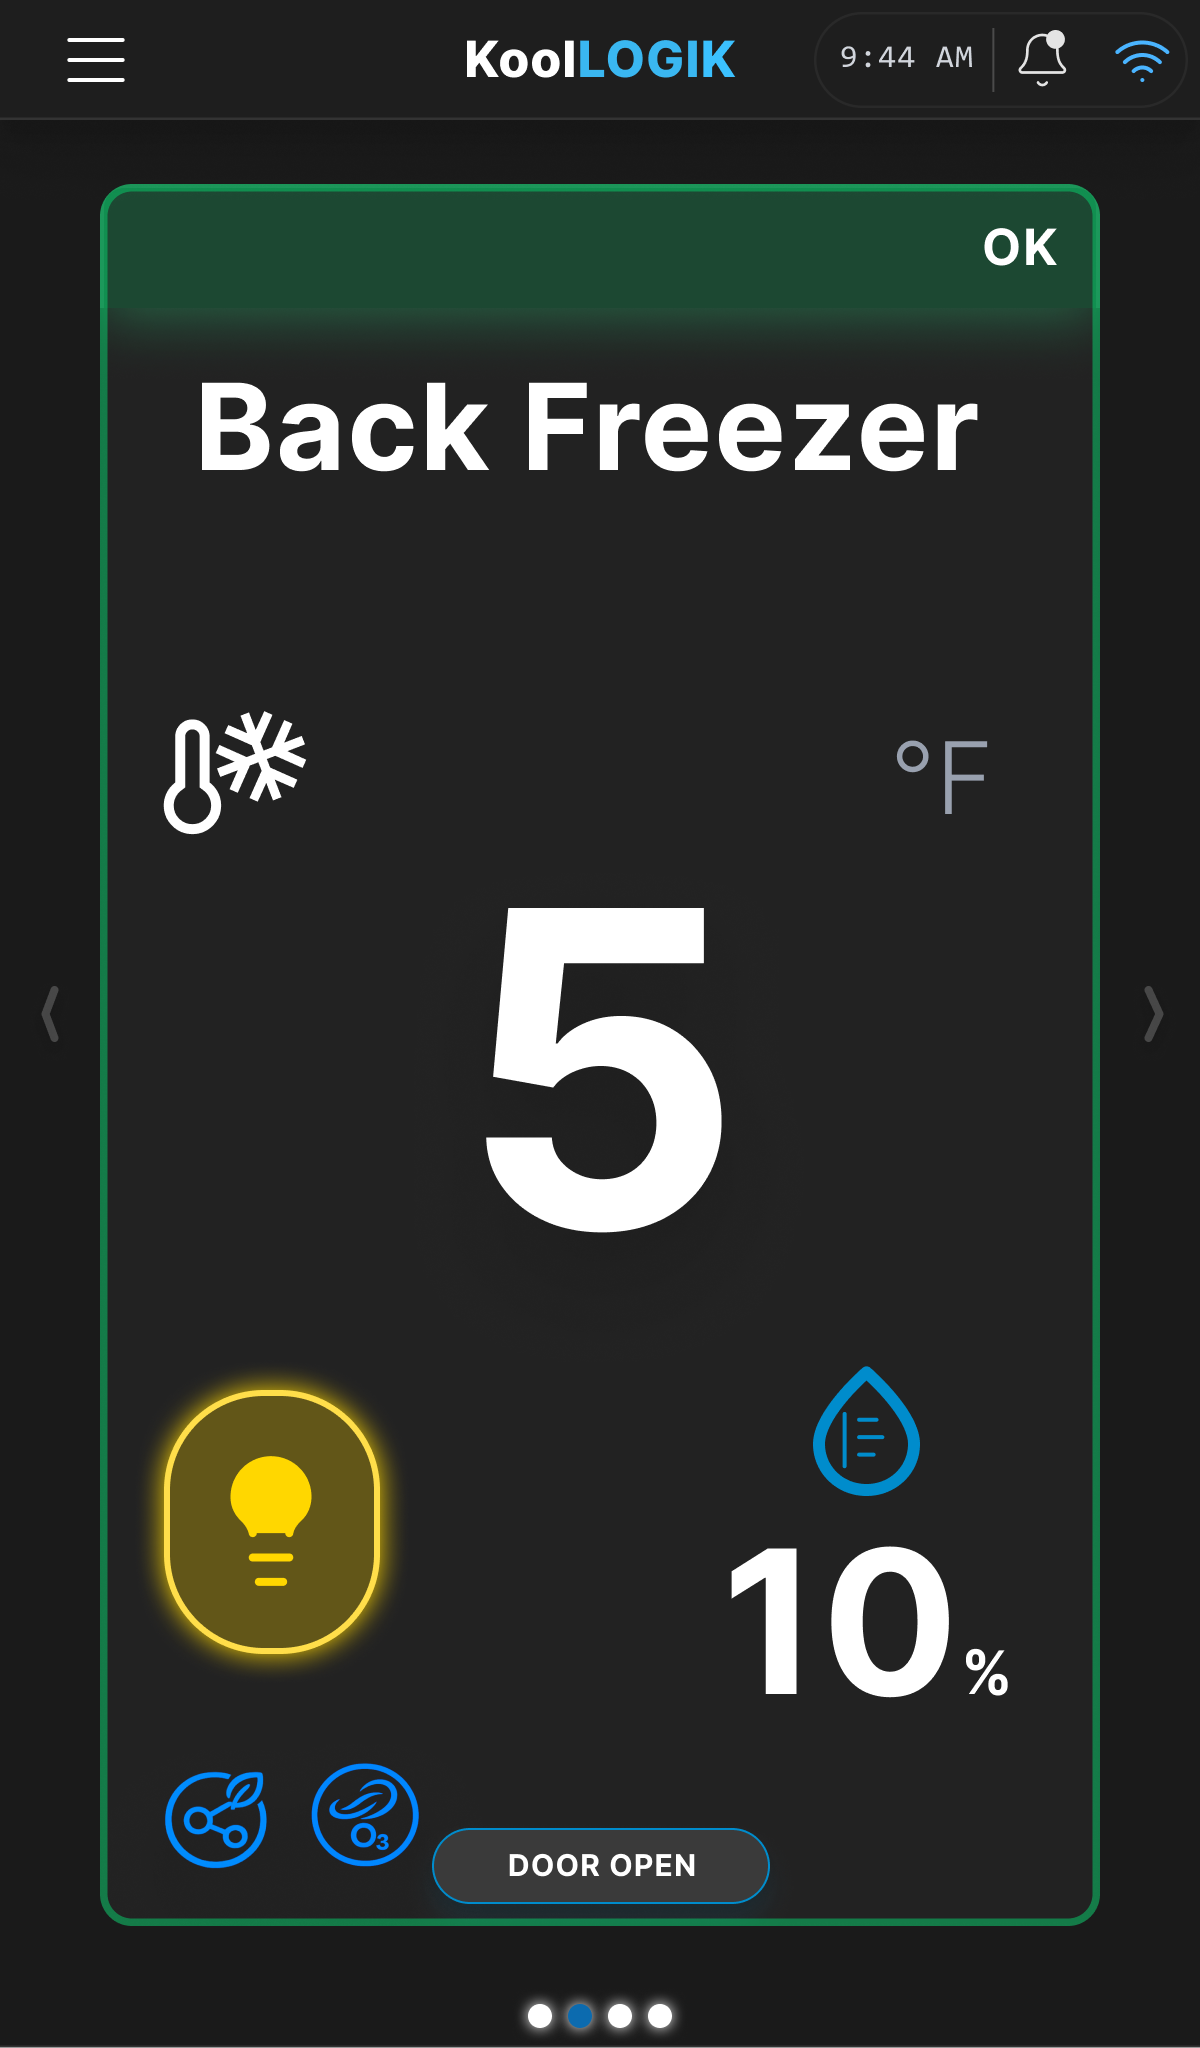
V3 · Final
Glanceable in 3 seconds
Temperature dominant, status visible, door state
shown, room list below.
User feedback
3-second rule achieved. 89% task success
rate.
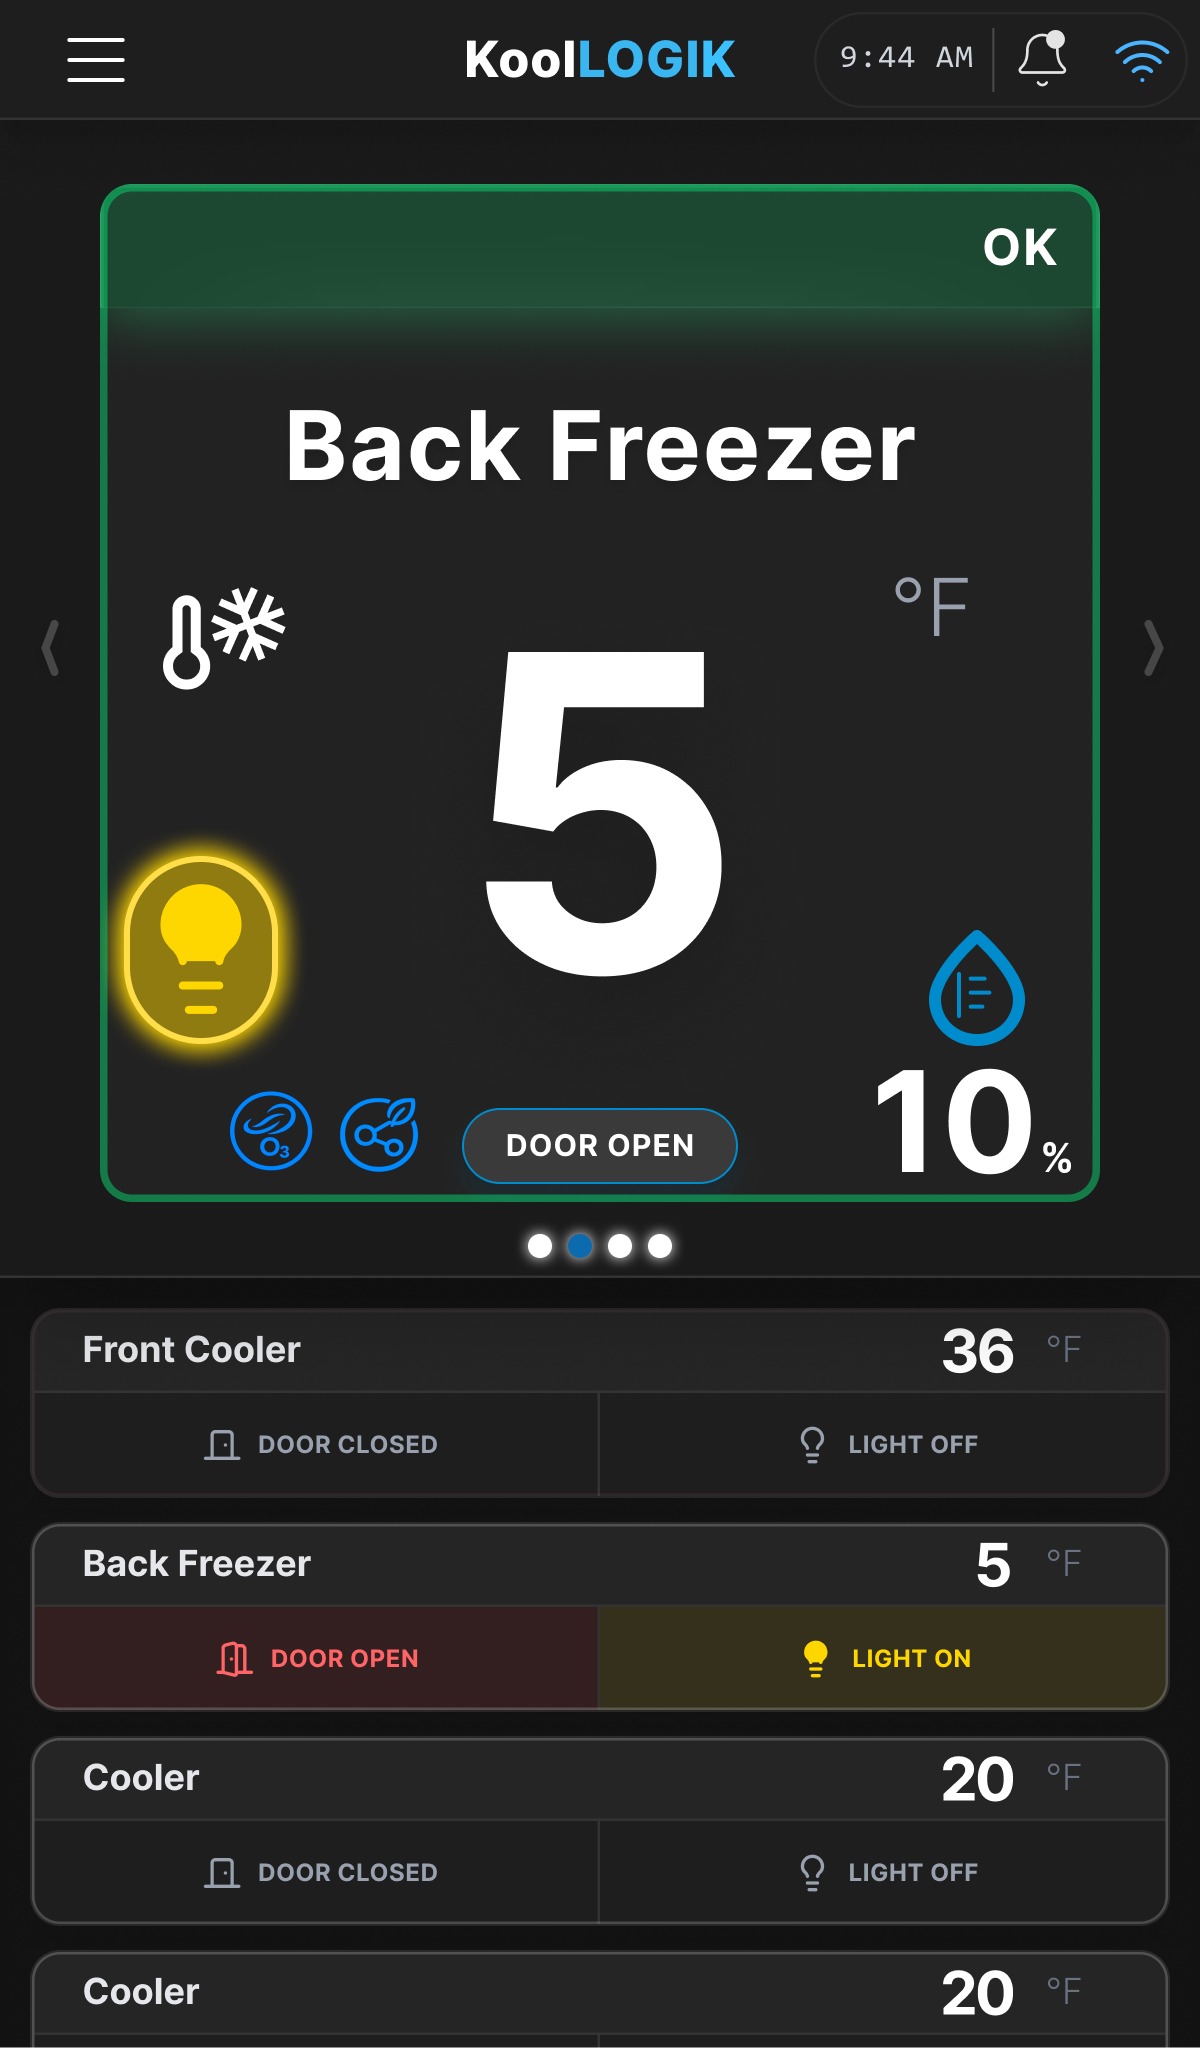
V3 · Final
Glanceable in 3 seconds
Temperature dominant, status visible, door state
shown, room list below.
User feedback
3-second rule achieved. 89% task success
rate.
Glanceability — % correct answers in < 3 seconds
Is it safe?
34%
V1
78%
V2
89%
V3 · final
What changed?
22%
V1
65%
V2
86%
V3 · final
What do I do now?
18%
V1
57%
V2
83%
V3 · final
06 · Home Screen Design
Glanceable in 3 seconds,
designed around operational clarity.
An operator should answer "Is it safe? What changed? What do I do now?" without reading a
single word of supporting text. Every element was designed from that constraint.
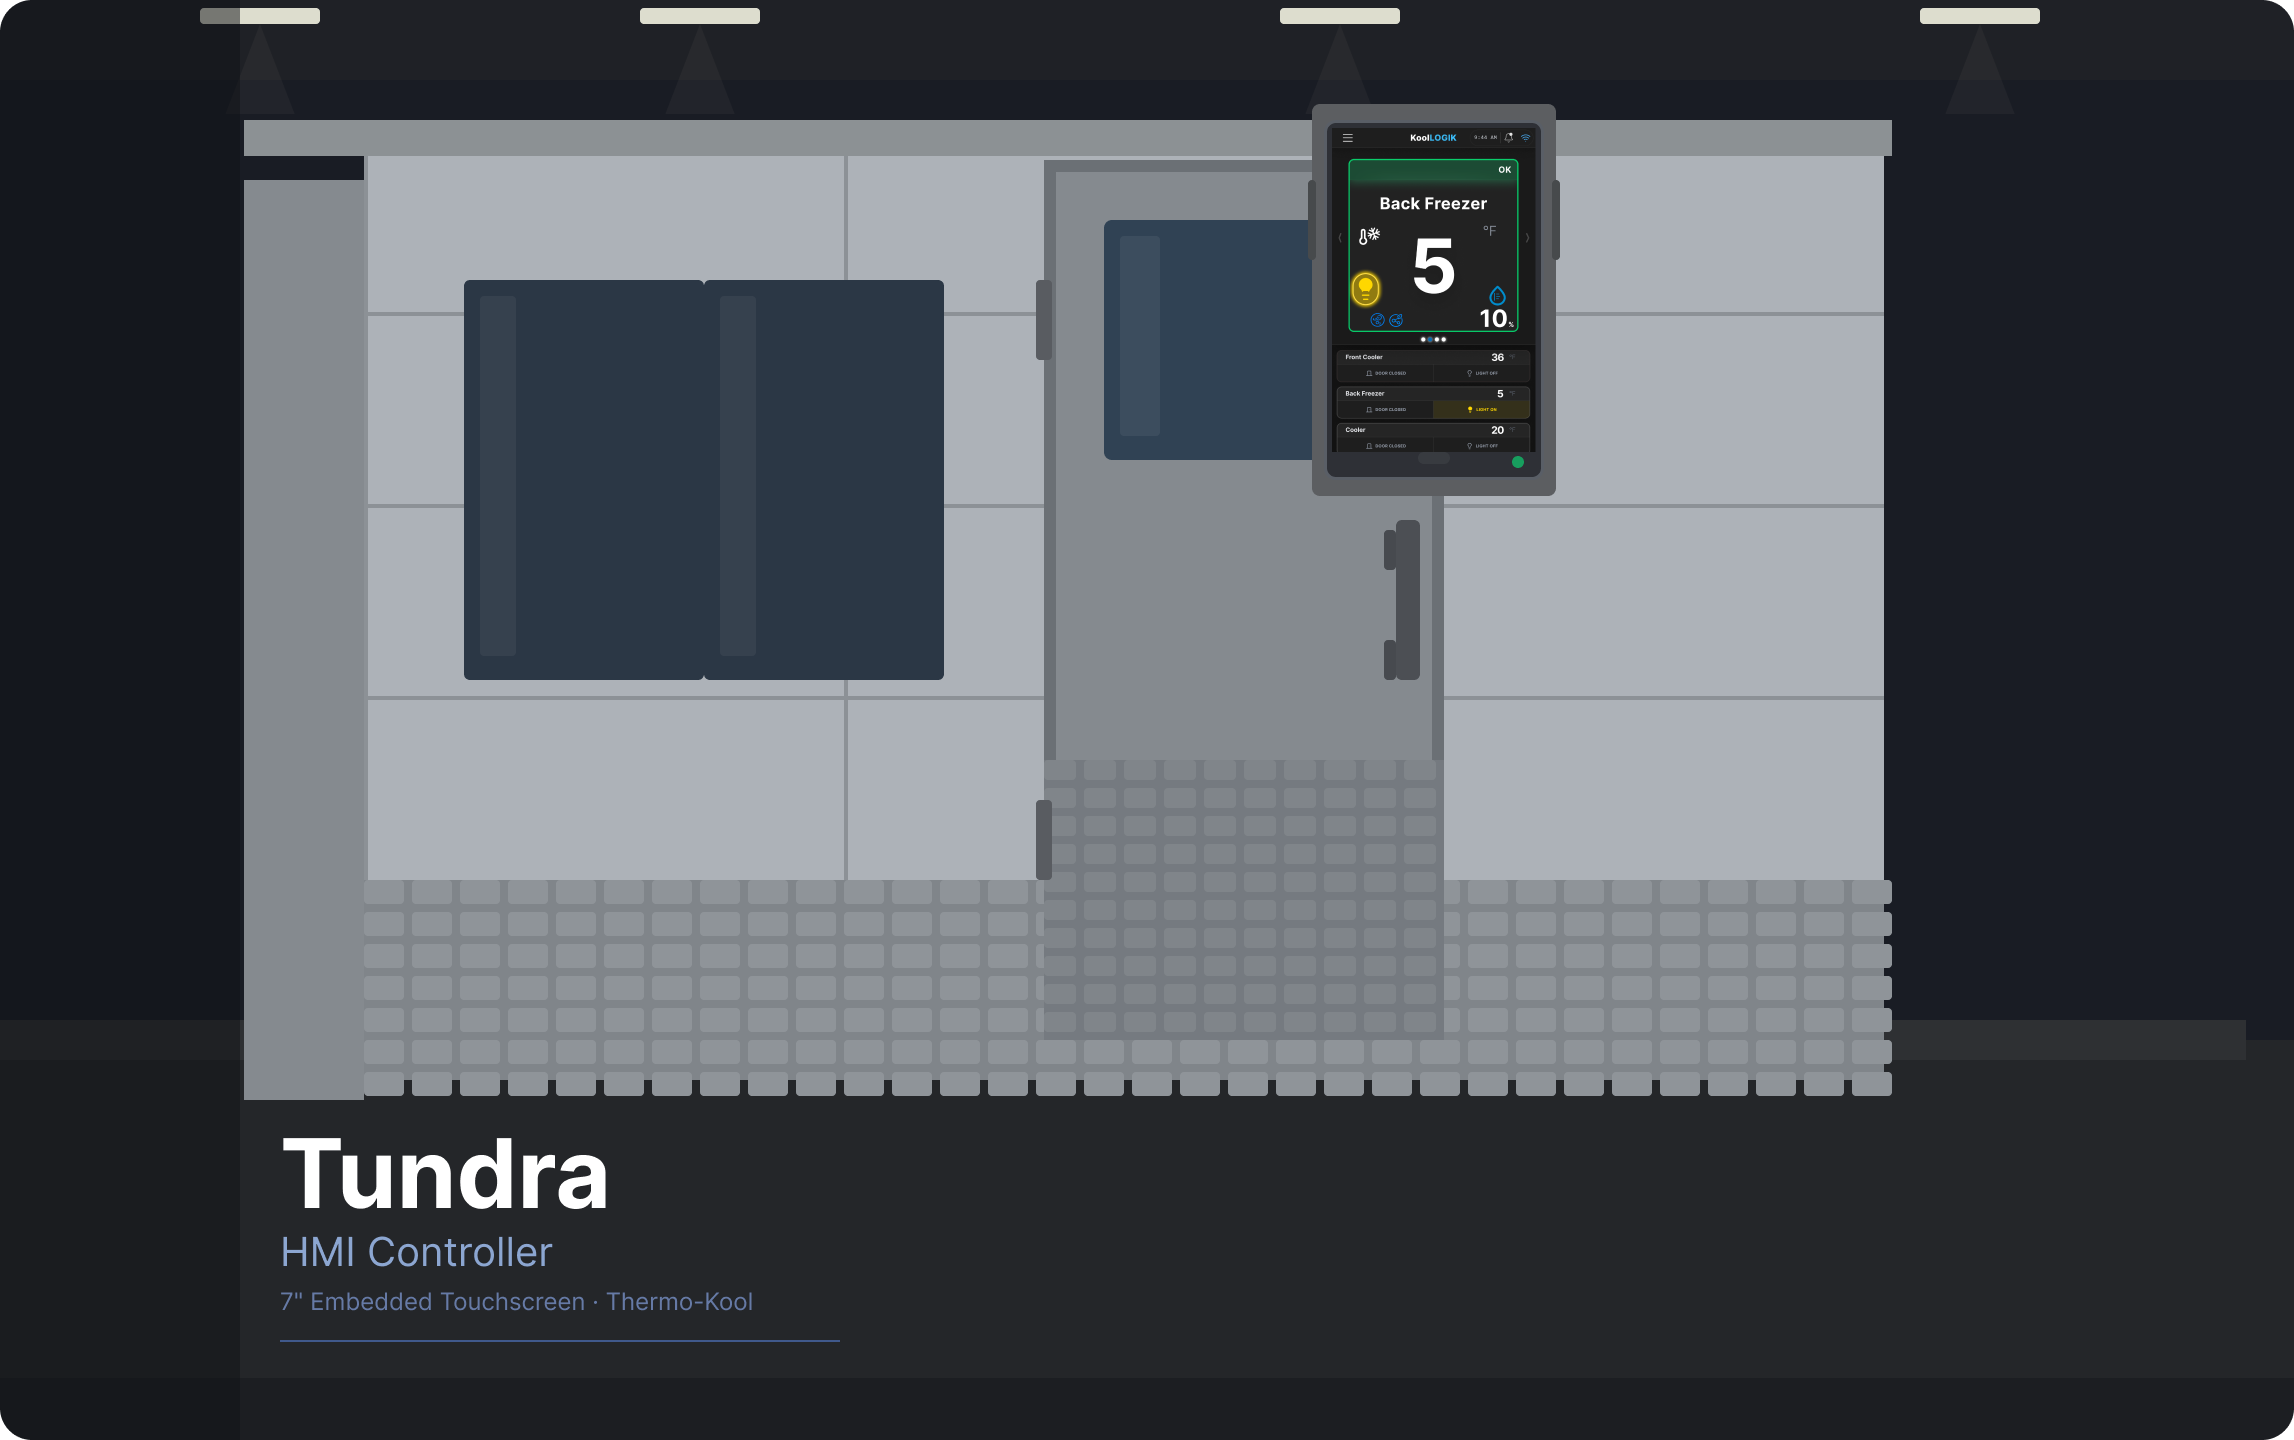
4 core design decisions
Decision
Rationale
01 — Temperature first
Largest element on screen. Operators make decisions based on temperature. Max visual weight by design.
02 — Redundant
signals
Every status = color + icon + text label. Never color alone. Critical for gloved use and color-blindness accessibility.
03 — Auto-rotation
Cycles through rooms every 15–20 seconds. Pauses on interaction. Locks to room on critical alarm.
04 — Room list below
Collapsed room list shows all zones simultaneously — no navigation needed to check other rooms.
Information hierarchy — relative visual weight
Temperature value
Primary decision data — maximum
visual weight
100%
100
Status indicator
Action signal — must be instantly
readable
65%
65
Room name
Context — supports orientation
50%
50
Door / light state
Secondary operational info
35%
35
Room list
Overview — accessible but not
dominant
25%
25
Navigation
Always accessible, never
competing
15%
15
07 · Alarm System
A 4-tier hierarchy designed around
human behavior, not technical triggers.
The original system had one flat alarm tier. Operators dismissed everything. The redesign
asked not "when to alert", but "what should the operator actually do?"
Tier
State
Description
Behavior
Operator
action
T1
Normal
System safe. Within all limits.
No notification. Green border. Passive monitoring.
None
T2
Warning
Parameter approaching limit.
Toast notification. Non-blocking. Auto-dismisses in 30s. Logged.
Monitor
T3
Critical
Unsafe condition. Action required.
Full-screen modal. Blocks interaction. Buzzer. Must acknowledge.
Acknowledge
T4
Panic
Life-safety emergency.
Emergency state. Evacuate prompt. Screen locks. Countdown.
Evacuate
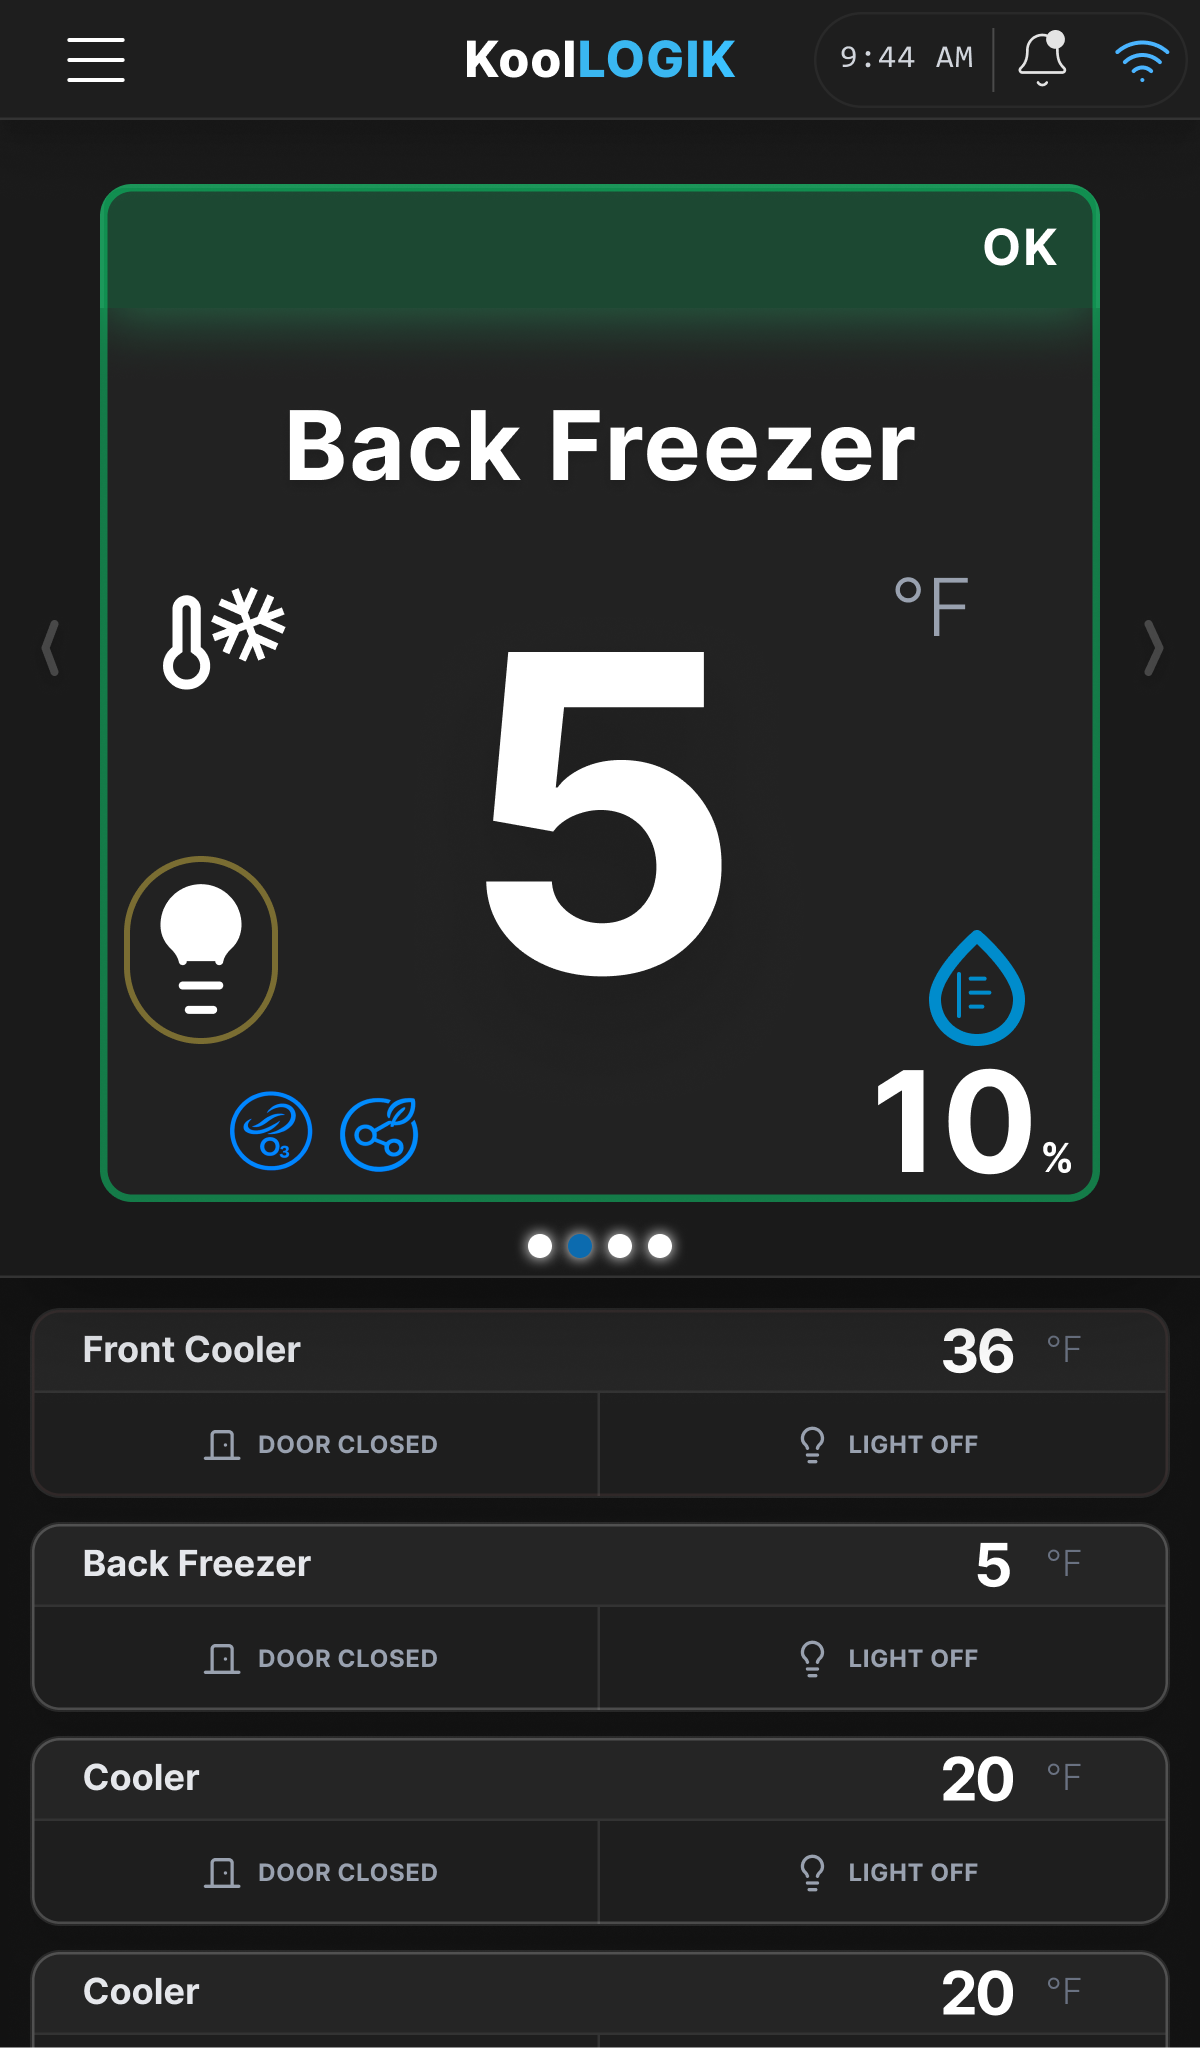
Home Dashboard
All rooms at a glance — temp, door, light. Solves manager's #1 pain: no walking room-to-room.
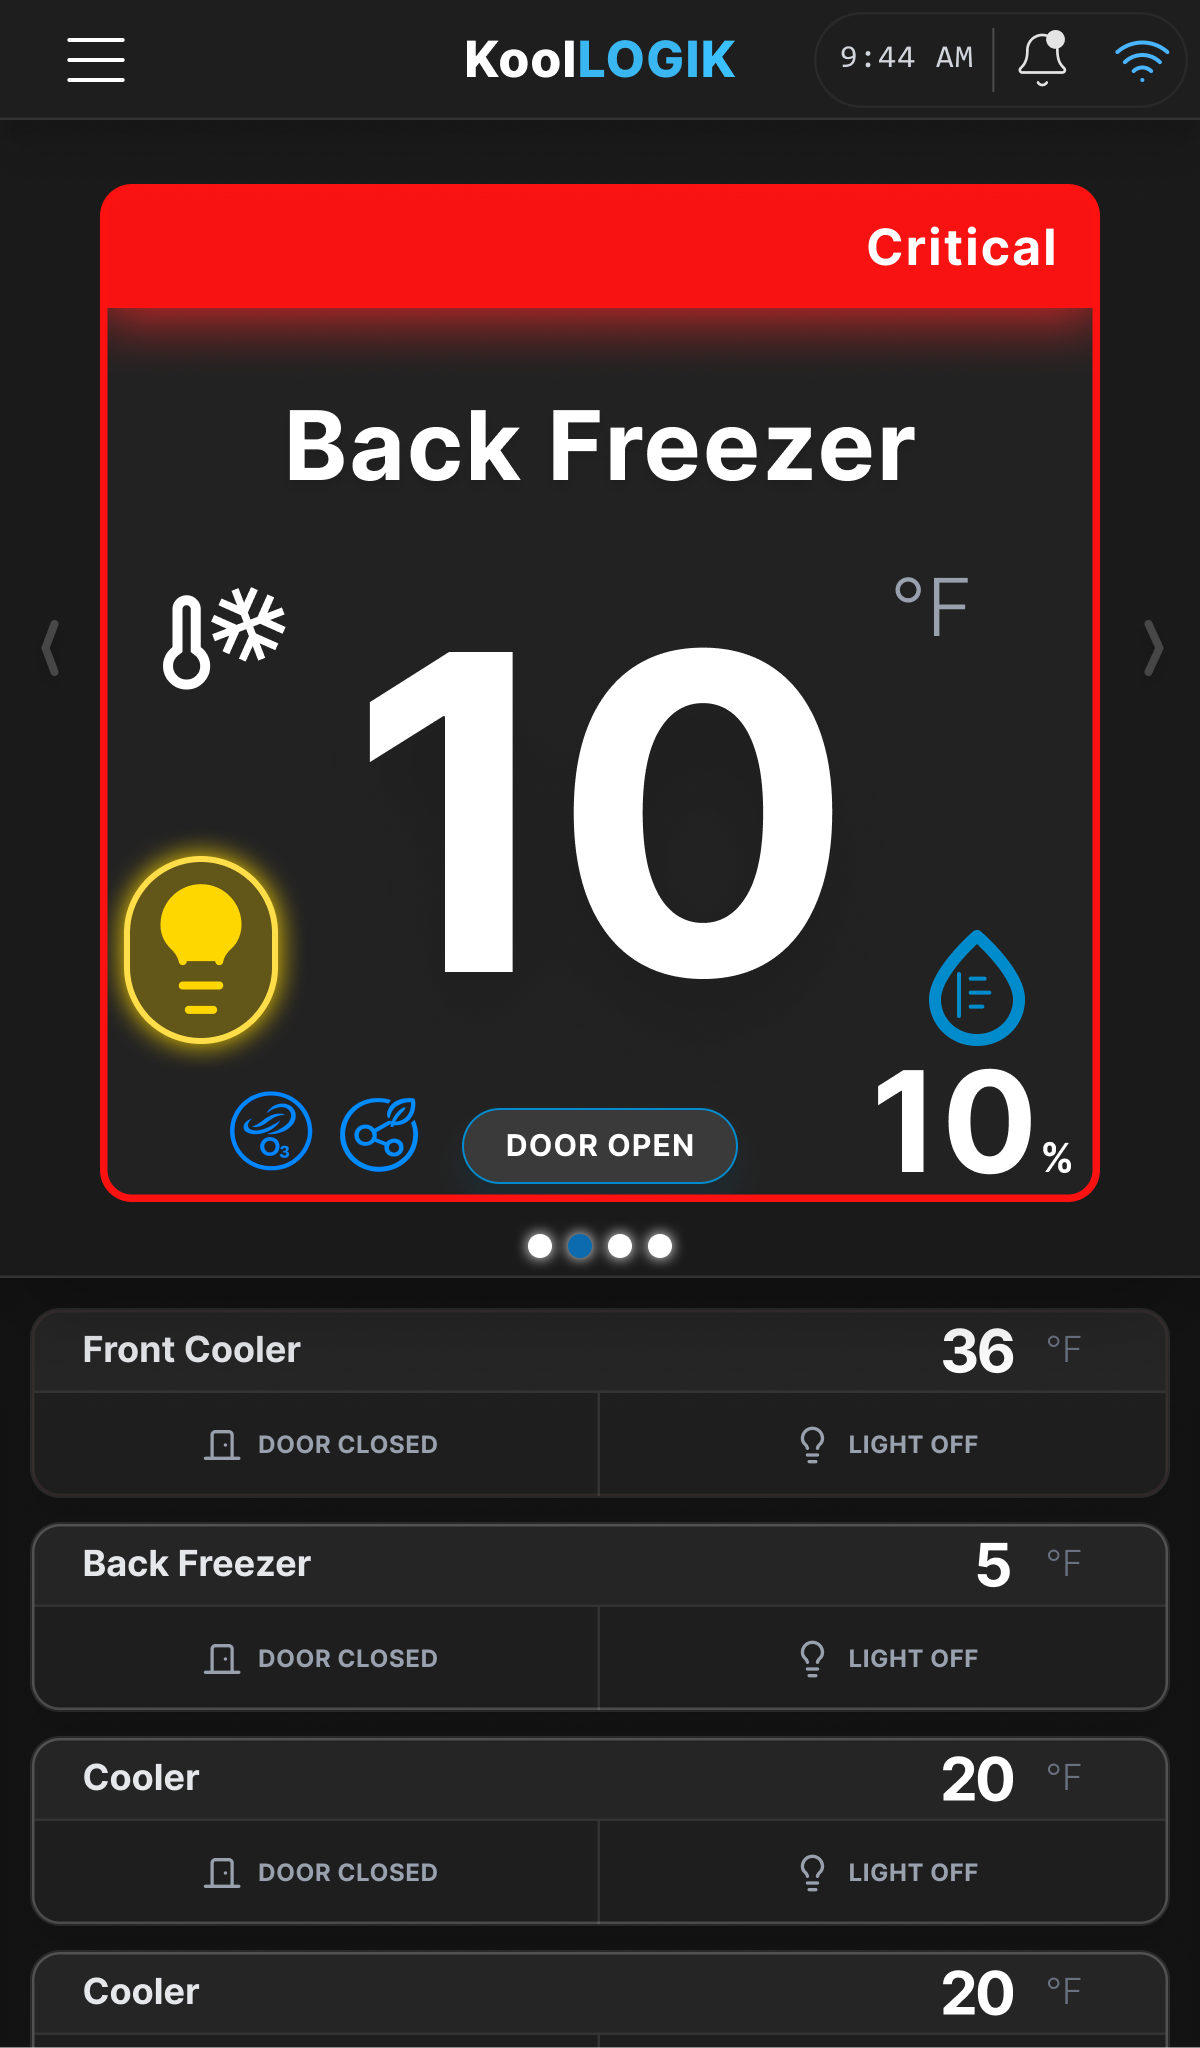
Critical Alarm State
Red banner, nav locked, silence button. Urgency impossible to miss. Solves alarm confusion.
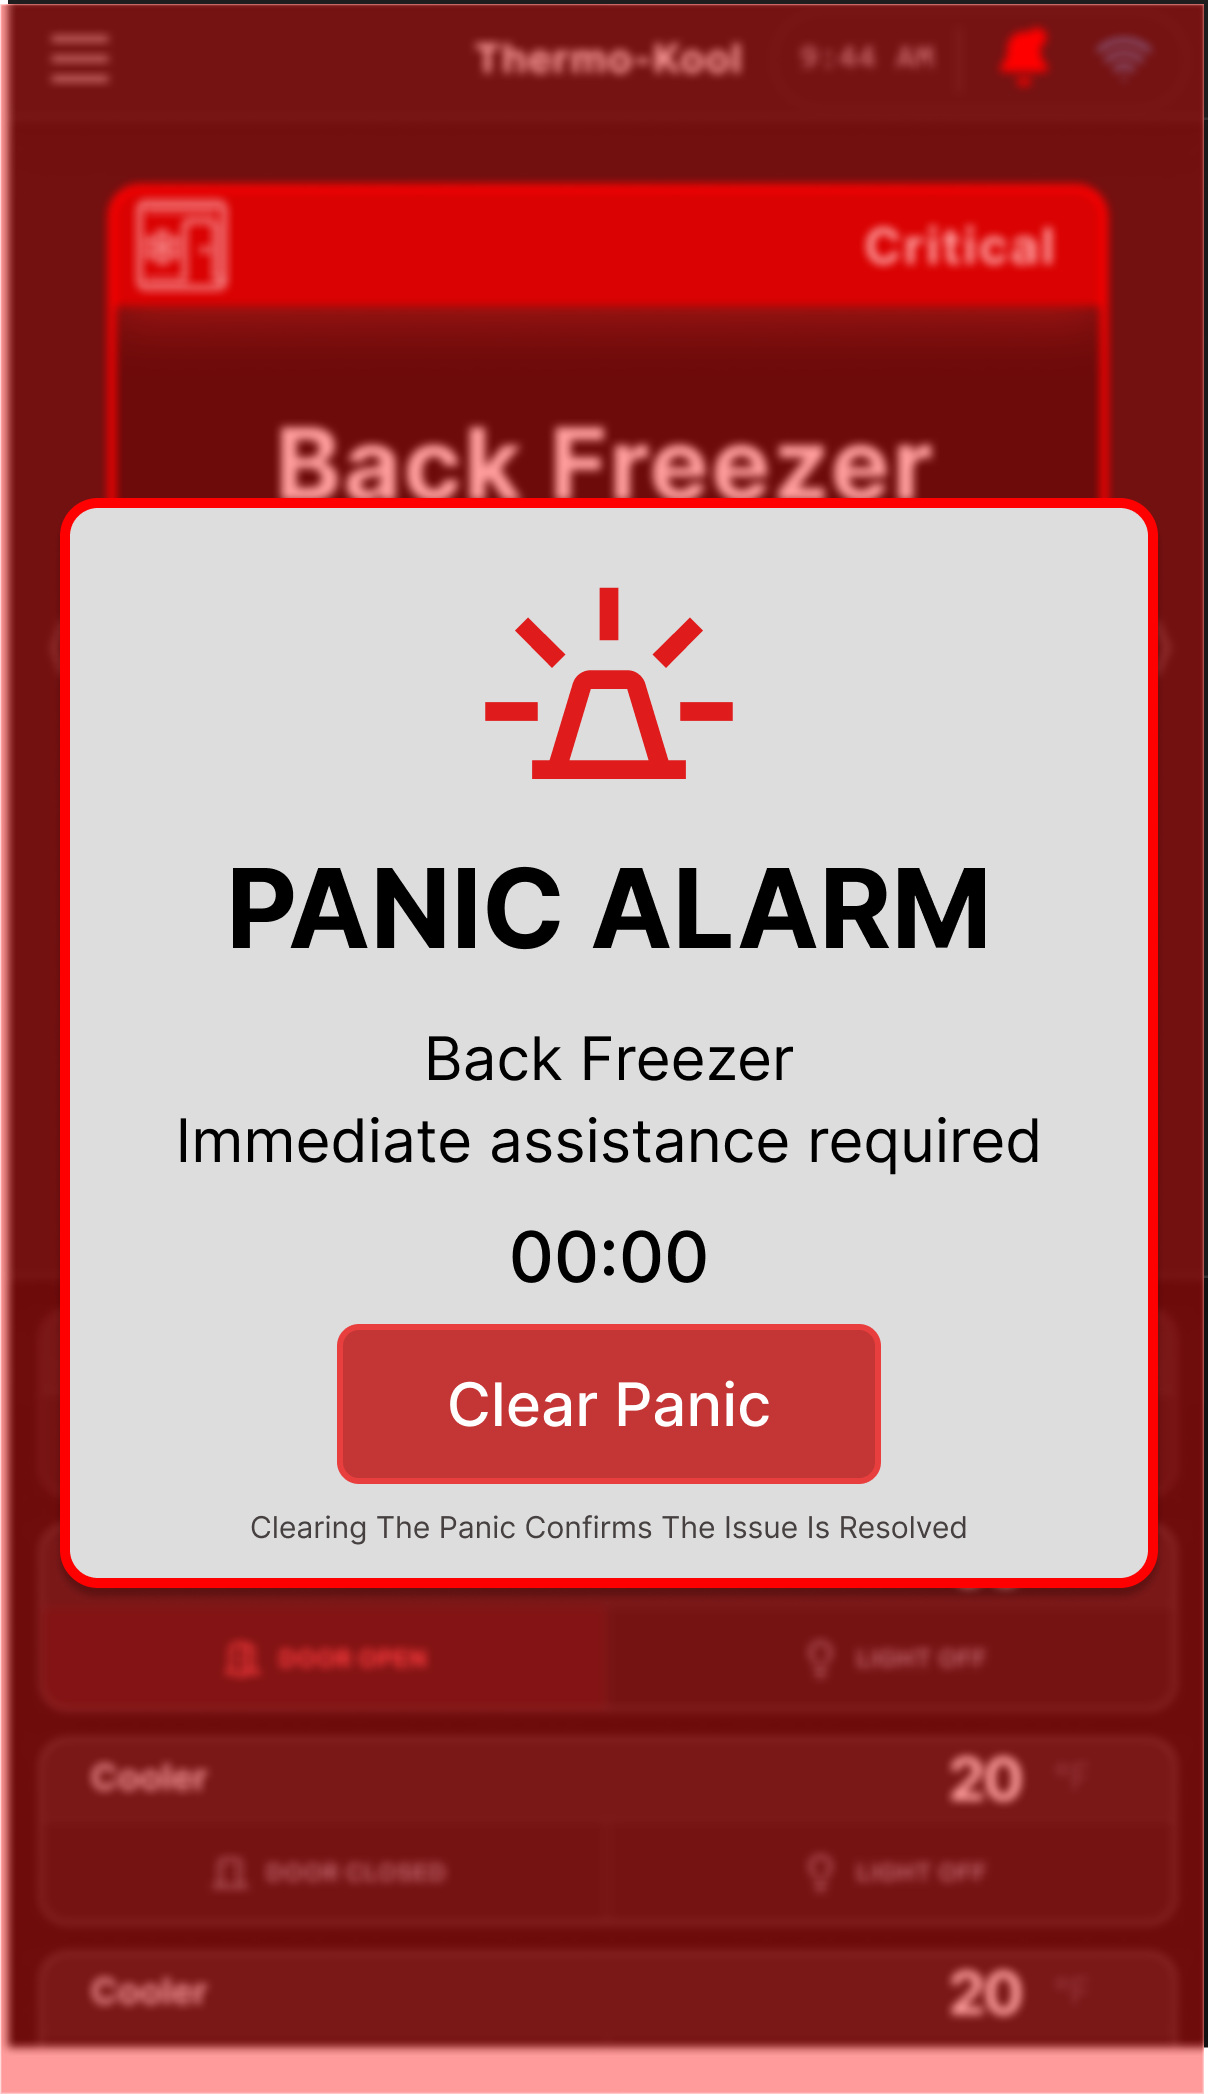
Panic — Full Screen
Overrides everything. Battery-backed. Works without WiFi or power. TK's hardware moat surfaced.
Escalation timeline — door left open
Time
Event
System response
0:00
Door opens
Normal state — no alert
5:00
Door still open
T2
Warning toast — non-blocking, logged
15:00
Door still open
T3
Critical modal — blocks screen, buzzer active
30:00
Unresolved
Buzzer escalates — increased urgency pattern
60:00+
Still unresolved
Service call flagged — logged for HACCP audit
Acknowledge ≠ Clear — the most important safety decision
Acknowledging an alarm silences the buzzer temporarily — but the visual warning stays
active until the fault is physically resolved. Operators often silence alarms without fixing issues.
Our system makes that structurally impossible: the unsafe condition remains visible on-screen
until it is actually resolved.
08 · Installer Setup Flow
From open-ended configuration to a 7-step guided workflow.
The setup flow was the #1 installer pain point. Manual configuration with no validation caused
wiring errors, repeat site visits, and lost installer confidence.
Before
10
steps
Manual configuration, no validation
After
7
steps
Guided with live wiring validation
Setup time
~45
min
Before redesign
Setup time
~18
min
60% faster, after redesign
7-step guided setup flow
Step 1
Choose Method
Preset or custom
Step 2
Room Count
1–4 rooms
Step 3
Name Rooms
Freezer A, Cooler B…
Step 4
Door Count
1–6 doors
Step 5 ★
Live Detection
Open each door ·
wiring validates
Step 6
Room Mapping
Assign relationships
Step 7
Validate & Apply
Confirm all mappings
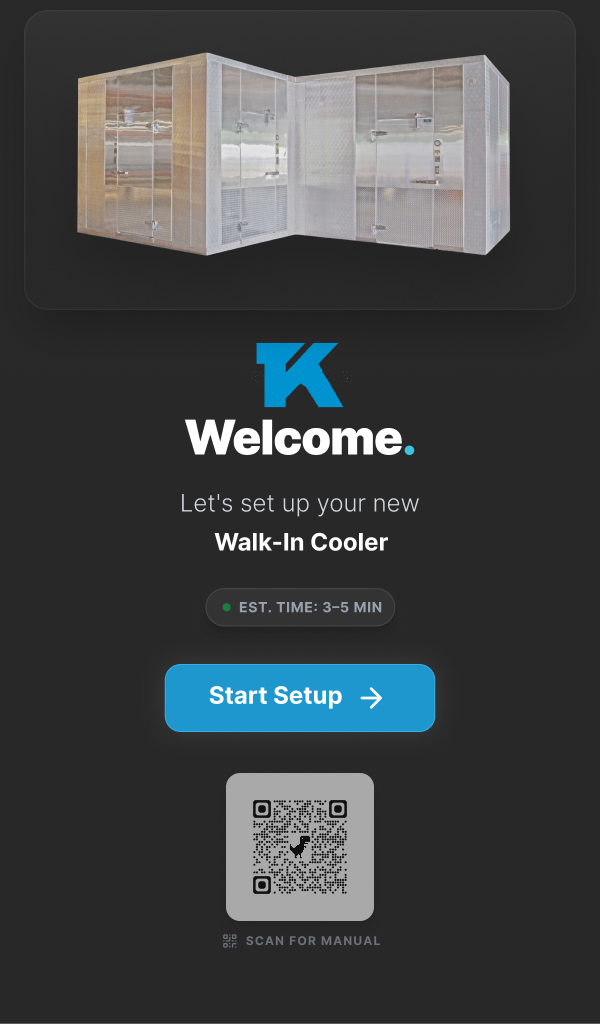
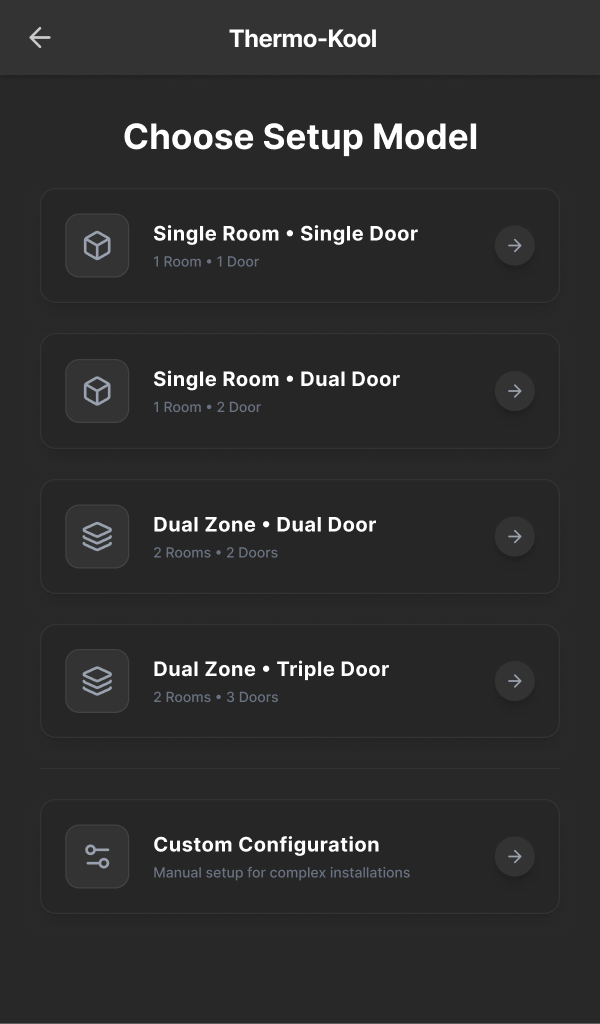
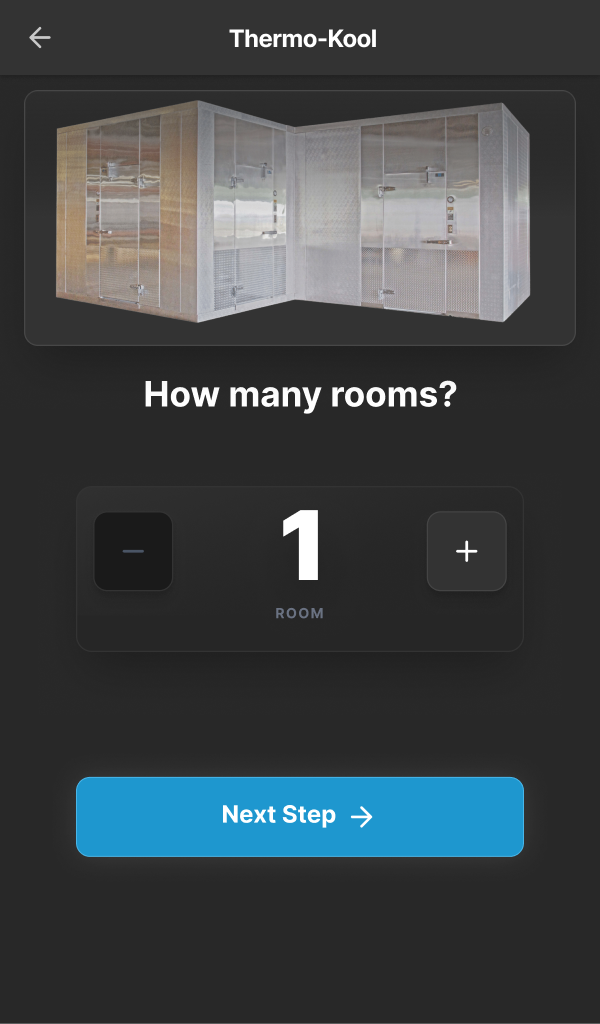
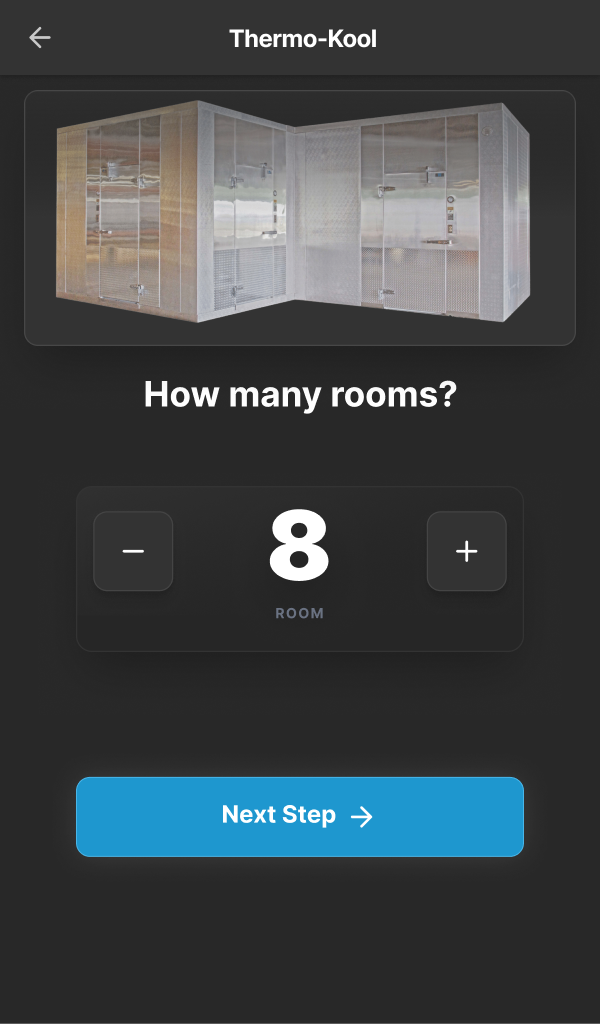
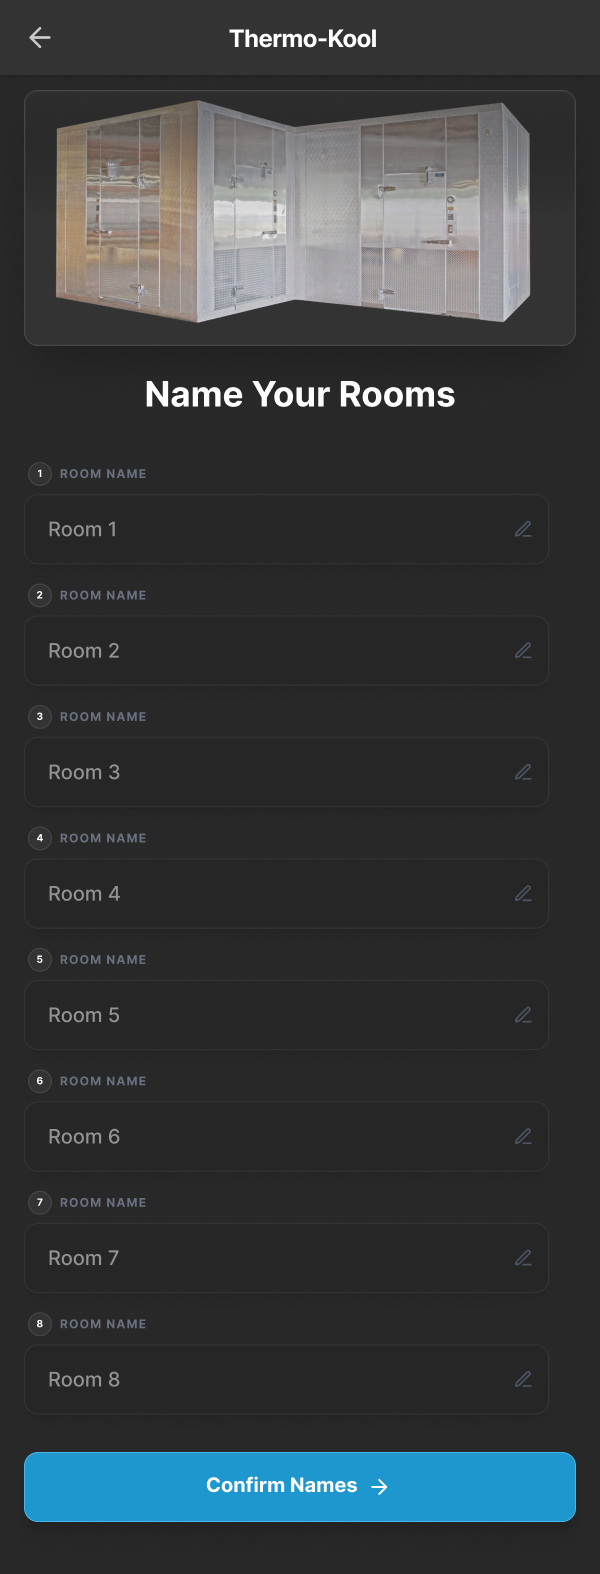
Critical insight · live door detection
Installers trust physical validation over digital labels. Instead of asking installers to guess
which digital card matches which physical door, we designed live detection: installer opens a
door physically → matching card turns green → wiring confirmed in real time. This eliminated
the #1 source of setup errors.
Before vs after — setup metrics
Metric
Before
After
Improvement
Number of steps
10 (manual)
7 (guided)
30% fewer
Average setup time
~45 min
~18 min
60% faster
Wiring errors per install
2.3 avg
0.1 avg
96% reduction
Repeat site visits
6 / month
~0
Eliminated
09 · HACCP & Diagnostics
Two distinct operational layers,
compliance and technical health.
HACCP (Hazard Analysis Critical Control Points) is a legal food-safety compliance
requirement. Diagnostics is the technician's toolkit. Both were designed as actionable
workflows, not data pages.
HACCP · Compliance logging
Tamper-evident logs for health inspections
Auto-logging
Temperature recorded every 15 minutes
Date/time stamps
All readings timestamped and tamper-evident
Alert logging
Alarm events logged with context and resolution
PDF export
Monthly report for health inspection
Cloud backup
Future: multi-site compliance sync
Diagnostics · Technician toolkit
Actionable health-state workflows
Symptom → Open Diagnostics → Check room health → Identify failing
sensor → Run validation → Replace / recalibrate → Confirm health state →
Log resolution.
Room:
· Temp sensor
· Humidity
· Door switch
· Light relay
· Motion
· Defrost
Diagnostic health indicators · example system state
Sensor / Component
Health
Status
Temperature sensor
97%
OK
Door switch
97%
OK
Motion sensor
82%
OK
Power input
61%
Warning — monitor
Communication
97%
OK
I/O board
97%
OK
10 · Usability Testing
3 tasks · 5 participants · validated with real users.
Task-based testing on the Figma prototype with 3 operators and 2 technicians across the
most critical workflows.
Participant
Role
Environment
Experience
P1
Operator A
Restaurant kitchen
3 years
P2
Operator B
Food distribution facility
1 year
P3
Operator C
Hotel kitchen
5 years
P4
Technician A
Field service
8 years
P5
Technician B
Install & service
4 years
Task results
Task
Description
Before
After
Improvement
Success
Task 1
Identify which room has an active alarm
18s avg
3.2s
83% faster
100%
Task 2
Configure a new door in setup flow
6.2 min
4.1 min
34% faster
80%
Task 3
Run diagnostics on a sensor failure
11 min
7 min
36% faster
90%
Top 3 usability findings
01
Temperature scale confusion
2 operators thought –4°C was dangerous (cold = danger in everyday life). They associated negative numbers with something wrong, not correct
refrigeration.
Change made:
Added ✓ SAFE label with green checkmark alongside the temperature number in the final design.
02
Setup backtrack anxiety
In V2, there was no way to go back during setup without losing all progress. This caused visible anxiety for installers — they were afraid to
continue.
Change made:
Added persistent back navigation + save-progress state to every setup step.
03
Alarm sound confusion
Technicians wanted to mute the alarm buzzer during active diagnostics without dismissing the alarm state. The single acknowledge action forced
an either/or choice.
Change made:
Added 'Mute Buzzer' as a separate action from 'Acknowledge Alarm' — solving the core cognitive conflict.
11 · Embedded UX Constraints
Designed for real conditions, not ideal ones.
Every decision was filtered through: does this work for someone
wearing gloves, in a cold
room, under stress, with limited training?
The constraints were the brief.
Constraint
Design response
Specification
Glove interaction
Minimum 44–48px touch targets throughout. No small tappable elements near edges. Large primary actions.
44–48px min
1024×600 resolution
Information hierarchy compressed to essentials. Temperature dominant. No secondary data competing on primary
view.
XL hierarchy
Cold / condensation
High-contrast UI. No color-only status signals. Reduced animations for embedded processor efficiency.
WCAG AA+
Distance readability
XL typography for temperature (52px). Large room name. Status indicators visible from 6 feet away.
6ft readable
Low-training users
No dead-end screens. Persistent navigation. Role-based access hides complexity from Level 1 operators.
3-level RBAC
Industrial noise
Visual alarm states are primary — buzzer is secondary. Critical alarms = full-screen takeover only.
Multi-modal
Touch target sizing
iOS / Android minimum
Baseline reference
44px
44px
KoolLogik minimum
All interactive elements
48px
48px
KoolLogik primary CTA
Primary action buttons
64px
64px
KoolLogik alarm dismiss
Alarm acknowledgment — extra
large for high-stress moments
72px
72px
12 · Outcomes & Impact
Measurable results across all 4 user types.
System in testing phase. All metrics based on usability testing and comparison against
previous software under equivalent conditions.
60
%
Faster installation
5 standard scenarios
83
%
Faster alarm response
18s → 3.2s · Task 1
96
%
Fewer config errors
Live door detection
100
%
Critical alarm coverage
Zero missed in testing
Qualitative outcomes by user type
User
Outcome
Operators
3-second rule achieved. Can answer "Is it safe?" at a glance. Alarm fatigue eliminated — critical alarms now treated as critical.
Installers
Live door detection means self-validated installs. Confidence dramatically improved. Repeat site visits eliminated in testing.
Technicians
Structured diagnostic workflows cut time-to-diagnosis. Room and system health clearly separated and visible at a glance.
Engineers
Architecture-first approach means future features — cloud, multi-site, predictive alerts — can be added without UI changes.
Status
Design reviewed and approved by Thermo-Kool leadership. Engineering implementation in
progress. Hardware testing ongoing through Q2 2025.
13 · Reflection & Learnings
What I took from this — and what I'd do differently.
Learning 01
Start with architecture, not screens
The biggest time savings on this project — and now a required first step
for me on any complex systems project. Most UX problems are actually
architecture problems. Once the entity relationships were defined, every
screen became significantly easier to design.
Next time: Run entity-relationship mapping in FigJam for every complex
product, before opening Figma.
Learning 02
Physical validation > digital labels
Live door detection worked because installers trust feedback they can feel
and see. Letting users validate through action, not assumption, applies to
any configuration-heavy product.
Next time: Ask 'can we validate this through a physical action?' earlier in
the design process.
Learning 03
Safety constraints = design opportunities
Acknowledge ≠ Clear became the most praised design decision in
stakeholder review. It started as a safety requirement and became a
product principle. Constraints don't limit design — they reveal what
actually matters most.
Next time: Document safety requirements as design constraints from day
one, not as review checklist items.
Learning 04
Translation is a core design skill
My most valuable contribution was translating firmware logic into
operational user needs — and back. In enterprise systems work, the
designer is often the only person who speaks both languages.
Next time: Push for direct firmware team sessions from week one. The
translation work starts in those conversations.
More Projects

Building a personalized, adaptive sleep ecosystem
Created a multi-device experience connecting wearables and smart beds to automatically adjust temperature and environment based on user data and sleep patterns.

Mobile Banking App Redesign
A complete redesign of a mobile banking experience focused on improving accessibility and reducing user friction in daily transactions.

Team Productivity Dashboard
Analytics dashboard for distributed teams that visualizes project progress, team collaboration, and individual contributions in real-time.